
Precisely speaking, it was about measuring expected credit loss using simplified approach for trade receivables – just to be on the safe side.
Since then, I keep receiving loads of questions such as:
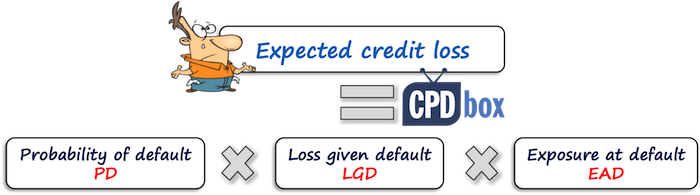
“Why did you not use three-part formula of EAD x LGD x PD?”
Answer: It’s a great formula, but not for everybody. Read more here later in this article.
“Why don’t we apply PD (probability of default) in provisioning matrix?”
Answer: It seems you are confusing two different methods of calculating ECL, please read more below.
“What if my debtors always pay, but very late? Do I have ECL?”
Answer: In short – yes. For more explanation, read below.
So from these and other questions I can see that there is a bit of confusion about calculating ECL and therefore I want to shed some light to this topic.
There is no imperative rule in IFRS 9.
Let me stress this out LOUD:
There is NO one single method of measuring the expected credit loss prescribed by IFRS 9.
Instead, it is YOU who needs to select the approach that fits your situation in the best way.
IFRS 9 only tells you that any method you select MUST reflect the following (see IFRS 9.5.5.17):
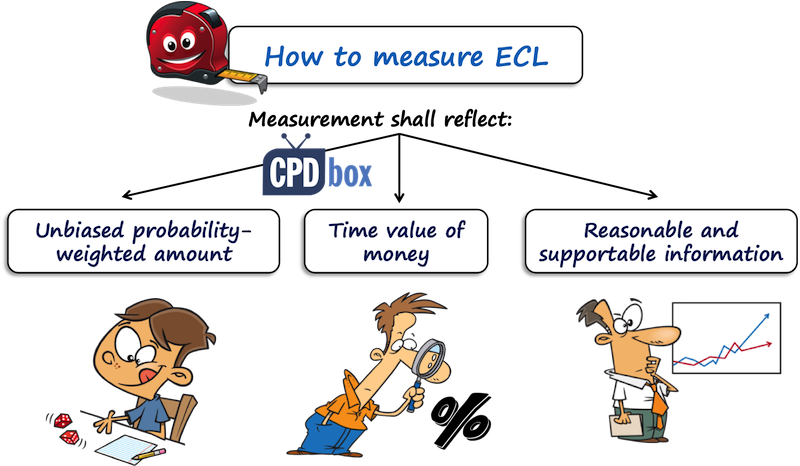
…to which you have arrived by assessing a range of possible outcomes.
Illustration: Imagine you have a debtor who owes you CU 1 000 000 (CU = currency unit) repayable in 2 years. There is some chance that due to economic downturn, the debtor will lose sales and as a result he would not be able to repay fully.
Special For You! Have you already checked out the IFRS Kit ? It’s a full IFRS learning package with more than 40 hours of private video tutorials, more than 140 IFRS case studies solved in Excel, more than 180 pages of handouts and many bonuses included. If you take action today and subscribe to the IFRS Kit, you’ll get it at discount! Click here to check it out!
And, you identify 3 different outcomes: either the debtor pays you in full, or pays you just 50% on time and the rest some years later, or goes bankrupt and you lose 100%.
You need to assess each of these outcomes, how probable they are, how much you would lose in each outcome and calculate ECL.
You should discount the estimated losses to the reporting rate.
This is done because the losses can occur in more than 12 months after the reporting date.
For example – the debtor from the above illustration should repay in 2 years and let’s say that can go bankrupt in 2 years.
Now, at the reporting date, when no payments from that debtor are due, you can still have expected credit loss because you might expect that the debtor will not repay anything in 2 years.
But, as the loss is expected in 2 years, it is necessary to bring it down to present value, because otherwise the loss would be greater than the carrying amount of a loan itself (as it IS in present value).
Also, you can incur the loss even if the debtor pays you in full, but later than expected, exactly due to time value of money.
One reader asked me a question:
“We trade with our government and have trade receivables towards them. The government always pays us, but the payment arrives 20-24 months later than due. Do we have some credit loss here?”
The answer is – YES, you do, exactly because the time value of money.
If the payments arrive a few months later, then you can probably ignore the time value of money as the period between the arrival of payment and due date is less than 1 year and thus the effect of discounting would not be material.
But, this is not the case when the payments arrive almost 2 years after due date.
…available without undue cost or effort at the reporting date about past events, current conditions and forecasts of future economic conditions.
Hmmm, I get LOADS of questions on this one.
How do we get loss rates since we are a new entity and have no historical data?
How do we incorporate forecasts if we have no information on them?
Well, let me tell you that sometimes you need to look at external sources of information and simply BUY the data.
Let’s say you are a new retail operator and have no history of payment discipline of your customers.
Thus you cannot calculate historical loss rates as I have done in this example.
OK, then you might need to apply the alternative approach.
For example – use the information from similar entities operating in similar industry in similar economic environment.
You can buy this info from credit bureaus, credit rating agencies, economical statistics prepared by central banks… you need to be a bit open-minded here and look for what is available in your country.
And remember – the standard does not say that the reasonable and supportable information must be obtained with NO cost at all.
It says “without undue cost and effort”, so yes, IFRS 9 practically says that you might incur some cost to get the info.
Here we are getting to the clarification of all those loss rates, probability of default rates, “three-part formula” and other terms related to measuring ECL.
Basically (that’s what most banks and other entities do), there are just two most popular methods:
Again, this is NOT imperative.
If you can come up with a different method – fine, apply it, but remember it must meet the three criteria set by IFRS 9 as described above.
Now let’s bring some clarity to these methods and illustrate them a bit.
Here, three elements enter into the calculation of expected credit loss:
The formula for calculating ECL using this method is here:
Let me illustrate this method a bit.
Let’s say that you have a debtor that owes you 1 000 CU repayable in 1 year. The debtor has severe financial troubles and your lawyers estimate that there is 20% chance of going bankrupt. If the debtor goes bankrupt, you would lose 70% of the amount he owes you. You lose nothing when there is no bankruptcy.
In this short example:
Thus, the expected credit loss is 20% x 70% x CU 1 000 = CU 140.
Sure, I ignored both of:
In reality, you need to take care about all of these things.
In fact, this calculation takes TWO outcomes in consideration:
The full formula is therefore:
I am just adding it here because you might have some loss even in “no default” situation due to late payments (time value of money!).
This method is preferred by banks and financial institutions, because they have large portfolios of loans and great internal credit rating system in place.
Special For You! Have you already checked out the IFRS Kit ? It’s a full IFRS learning package with more than 40 hours of private video tutorials, more than 140 IFRS case studies solved in Excel, more than 180 pages of handouts and many bonuses included. If you take action today and subscribe to the IFRS Kit, you’ll get it at discount! Click here to check it out!
Also, this method is compatible with Basel capital framework requirements, so the banks need to make a few adjustments to make it in line with both Basel and IFRS 9, too.
I would also say that probabilities of default include certain forward-looking insights in them and are not based purely on past statistics, thus they are OK with IFRS 9.
However, for trade receivables and other financial assets where you can apply simplified approach, this is not very convenient, because of challenges involved in getting the necessary information.
It is quite difficult to develop internal statistical models for getting PDs and other information.
Therefore, most companies use the second approach for their trade receivables and other financial assets where simplified model is applied: loss rate model.
Here, you do NOT need any probability of default (PD) and other details.
The two things that you need are:
When you are using so called “provision matrix”, you are applying loss rate approach in fact.
I am not bringing any illustration of this method here, because it is fully and in detail showed here.
This method is quite simple, because you can always calculate the loss rates of your receivables (if you are a new entity, then read above for guidance).
However, there are two drawbacks of this method:
Any questions? Please let me know in the comments below this article. Thank you!